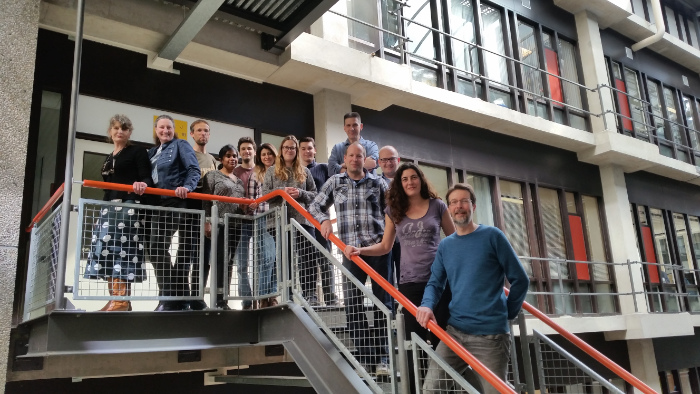
The Bioinformatics Laboratory was initiated by Antoine van Kampen in 1997 to advance and support biomedical research at the Amsterdam University Medical Centers (location AMC). Nowadays, the laboratory is part of the Epidemiology & Data Science (EDS) department. The group members represent a broad range of expertise in (bio)informatics, biostatistics and computational modelling, and have experience with a large variety of omics data and the use of public databases. The Bioinformatics Laboratory engages in research, education, and support.
One of our first publications resulting from a collaboration with the group of prof. dr. Rogier Versteeg about the human transcriptome map published in Science together with the first draft of the Human genome. Based on SAGE data.
Figure shows whole chromosome view of gene expression levels of the 1208 UniGene clusters mapped to chromosome 11 on the GB4 radiation hybrid map of GeneMap’99. Each unit on the vertical axis represents one UniGene cluster. Expression is shown for SAGE libraries of 8 out of the 12 available tissue types. Expression levels from 0 to 15 tags are shown by horizontal blue bars. Tag frequencies over 15 are shown by red bars. The blue-only section to the right represents a moving median with a window size of 39 UniGene clusters generated from the expression levels in “all tissues.” Green bars indicate Regions of Increased Gene Expression (RIDGEs). The boxed region shows the tissue-specific expression of a cluster of five metalloproteinases and two apoptosis inhibitors in normal breast tissue and breast cancer tissue.
Caron H, van Schaik B, van der Mee M, Baas F, Riggins G, van Sluis P, Hermus MC, van Asperen R, Boon K, Voûte PA, Heisterkamp S, van Kampen A, Versteeg R. (2001) The human transcriptome map: clustering of highly expressed genes in chromosomal domains. Science. 291(5507):1289-92.


